

Embedded Reports
Bring your data to your audience with Embedded Reports
Share interactive dashboards and charts directly on your site
A closer look
Share your data where it matters most
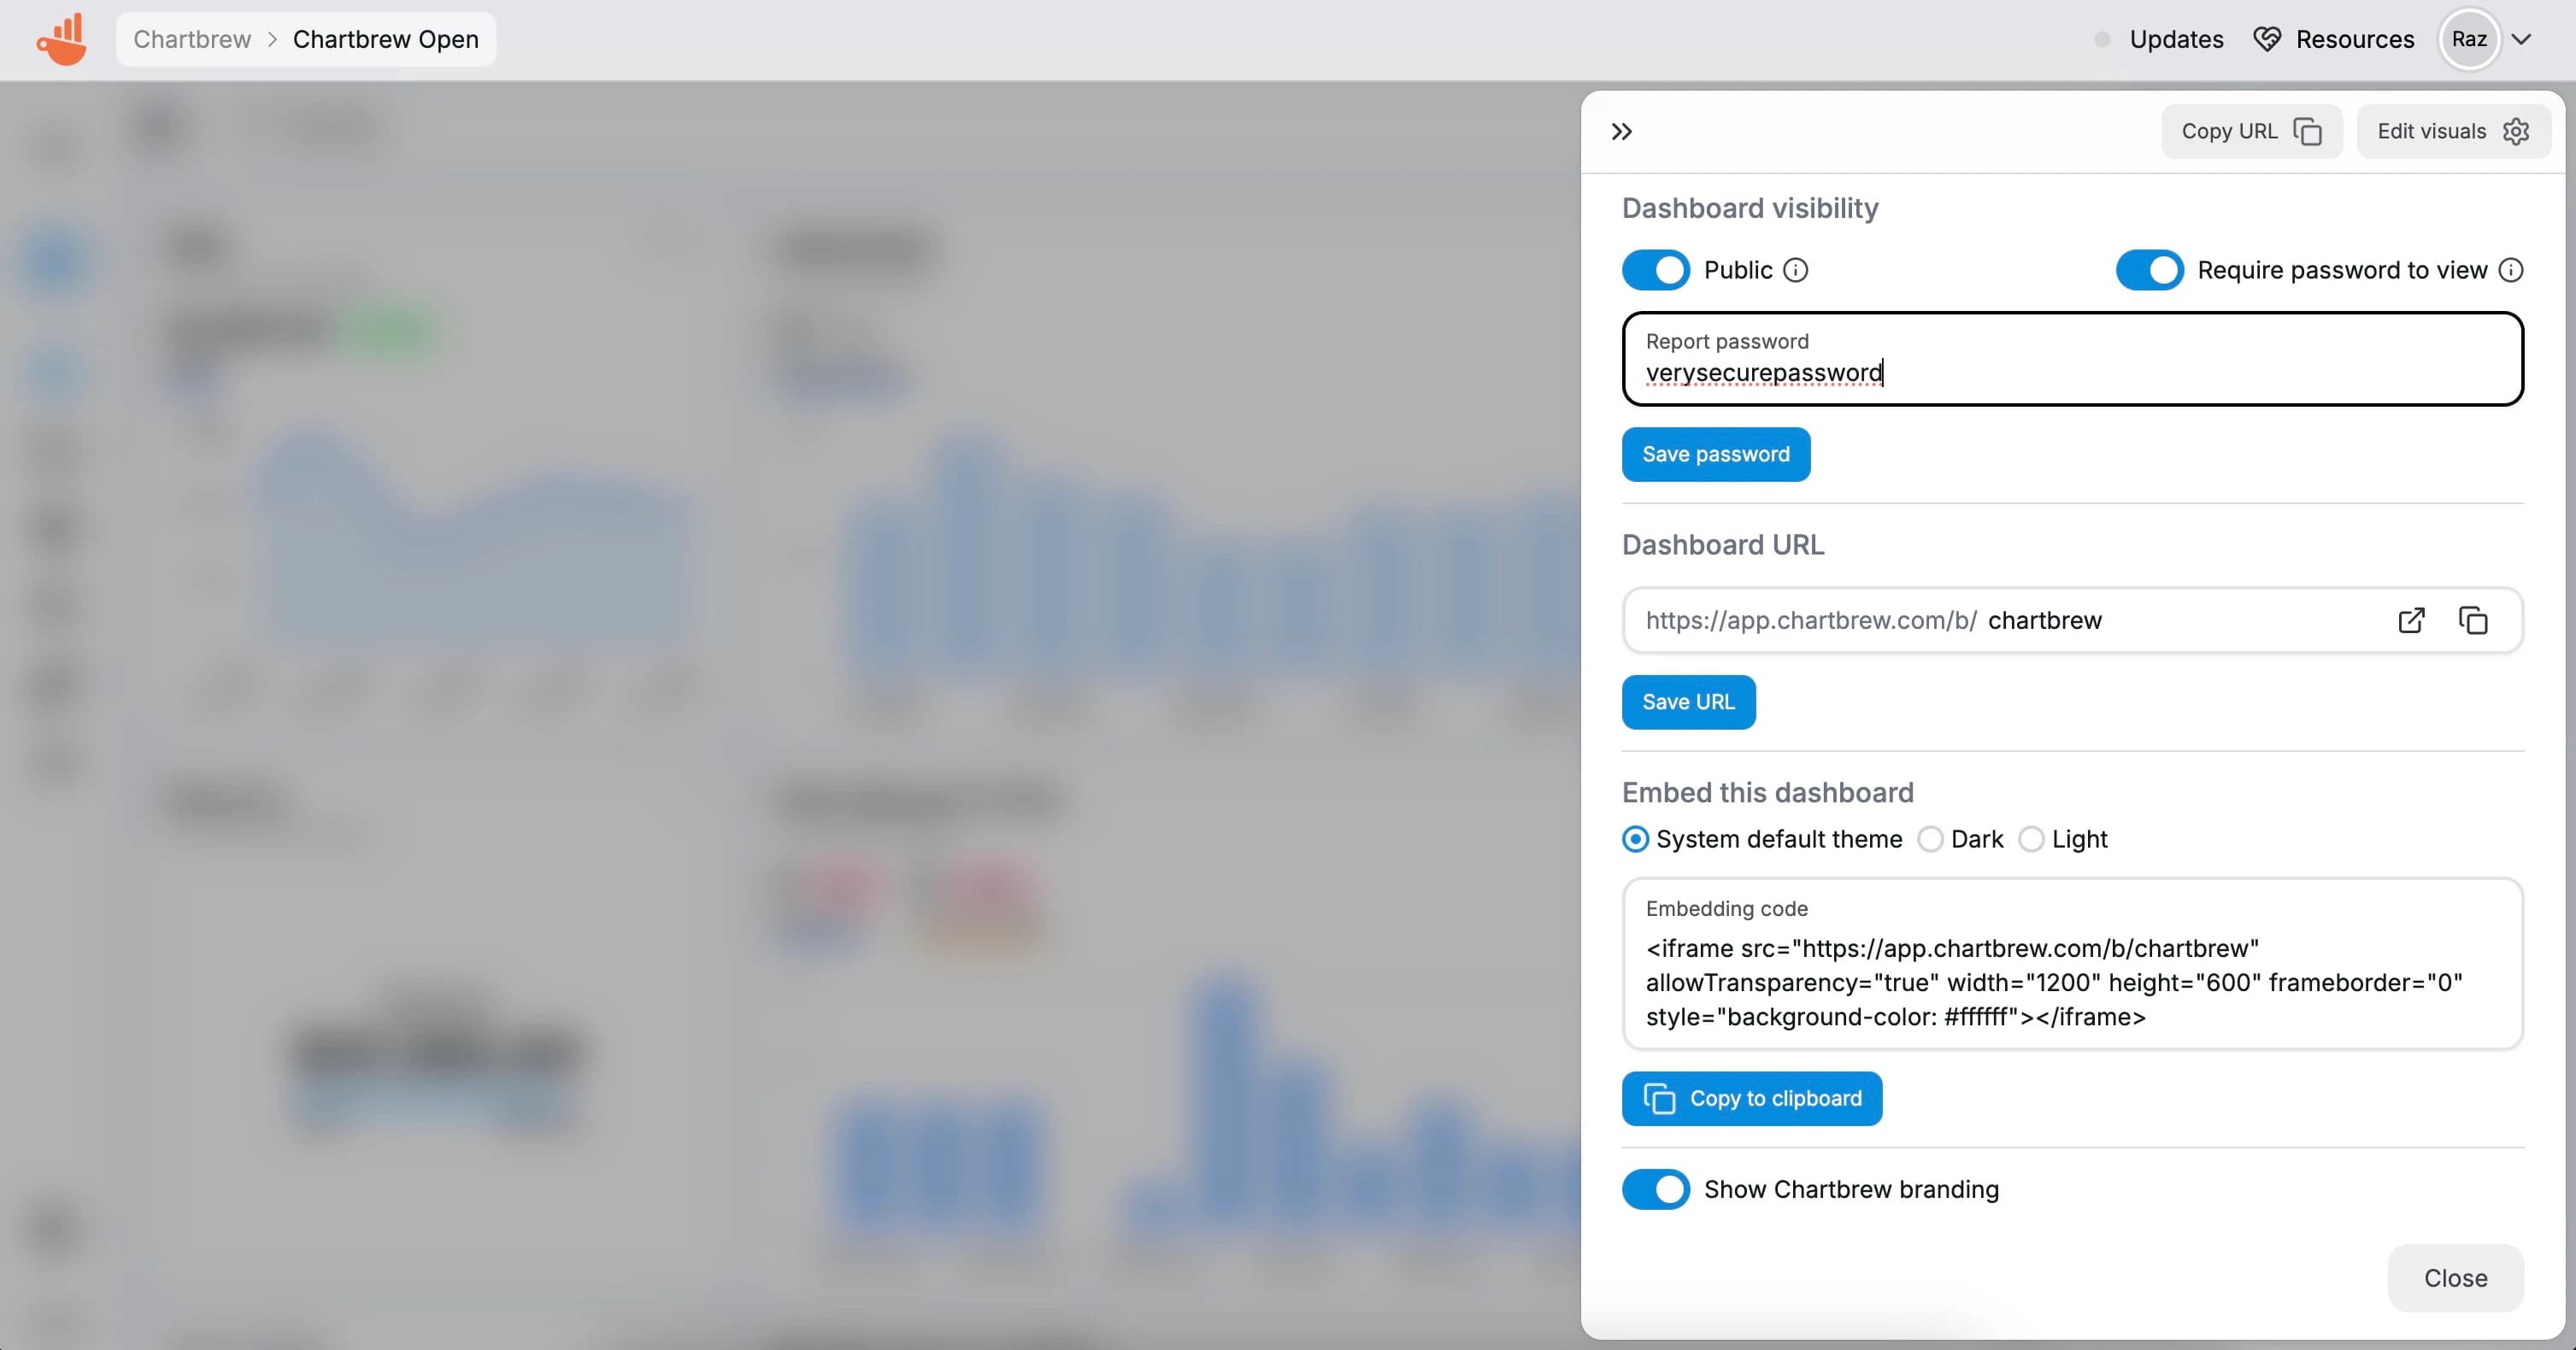
Chartbrew lets you take your data visualization to the next level by embedding interactive dashboards and charts directly into your website or app. Create a seamless experience for your audience by enabling them to explore data, apply filters, and uncover insights—all without leaving your site.
With customizable branding options, your embedded reports can match your company’s identity for a polished and professional look. Plus, you can add password protection to keep your data secure and accessible only to the right people.
Made for your workflow
What you can do.
Interactive dashboards
Enable users to filter and interact with data directly in the embed.
Embedded charts
Add individual charts to pages with ease.
Custom branding
Tailor the look and feel to match your brand identity.
Password protection
Control who can view your reports with secure access.
Responsive design
Embeds look great on any device, ensuring an optimal experience for all viewers.
Real-time updates
Embedded dashboards and charts update automatically to show the latest data.
