

Report Builder
Build powerful reports with ease
Unlock insights with our intuitive report builder software
A closer look
Start building reports that make an impact
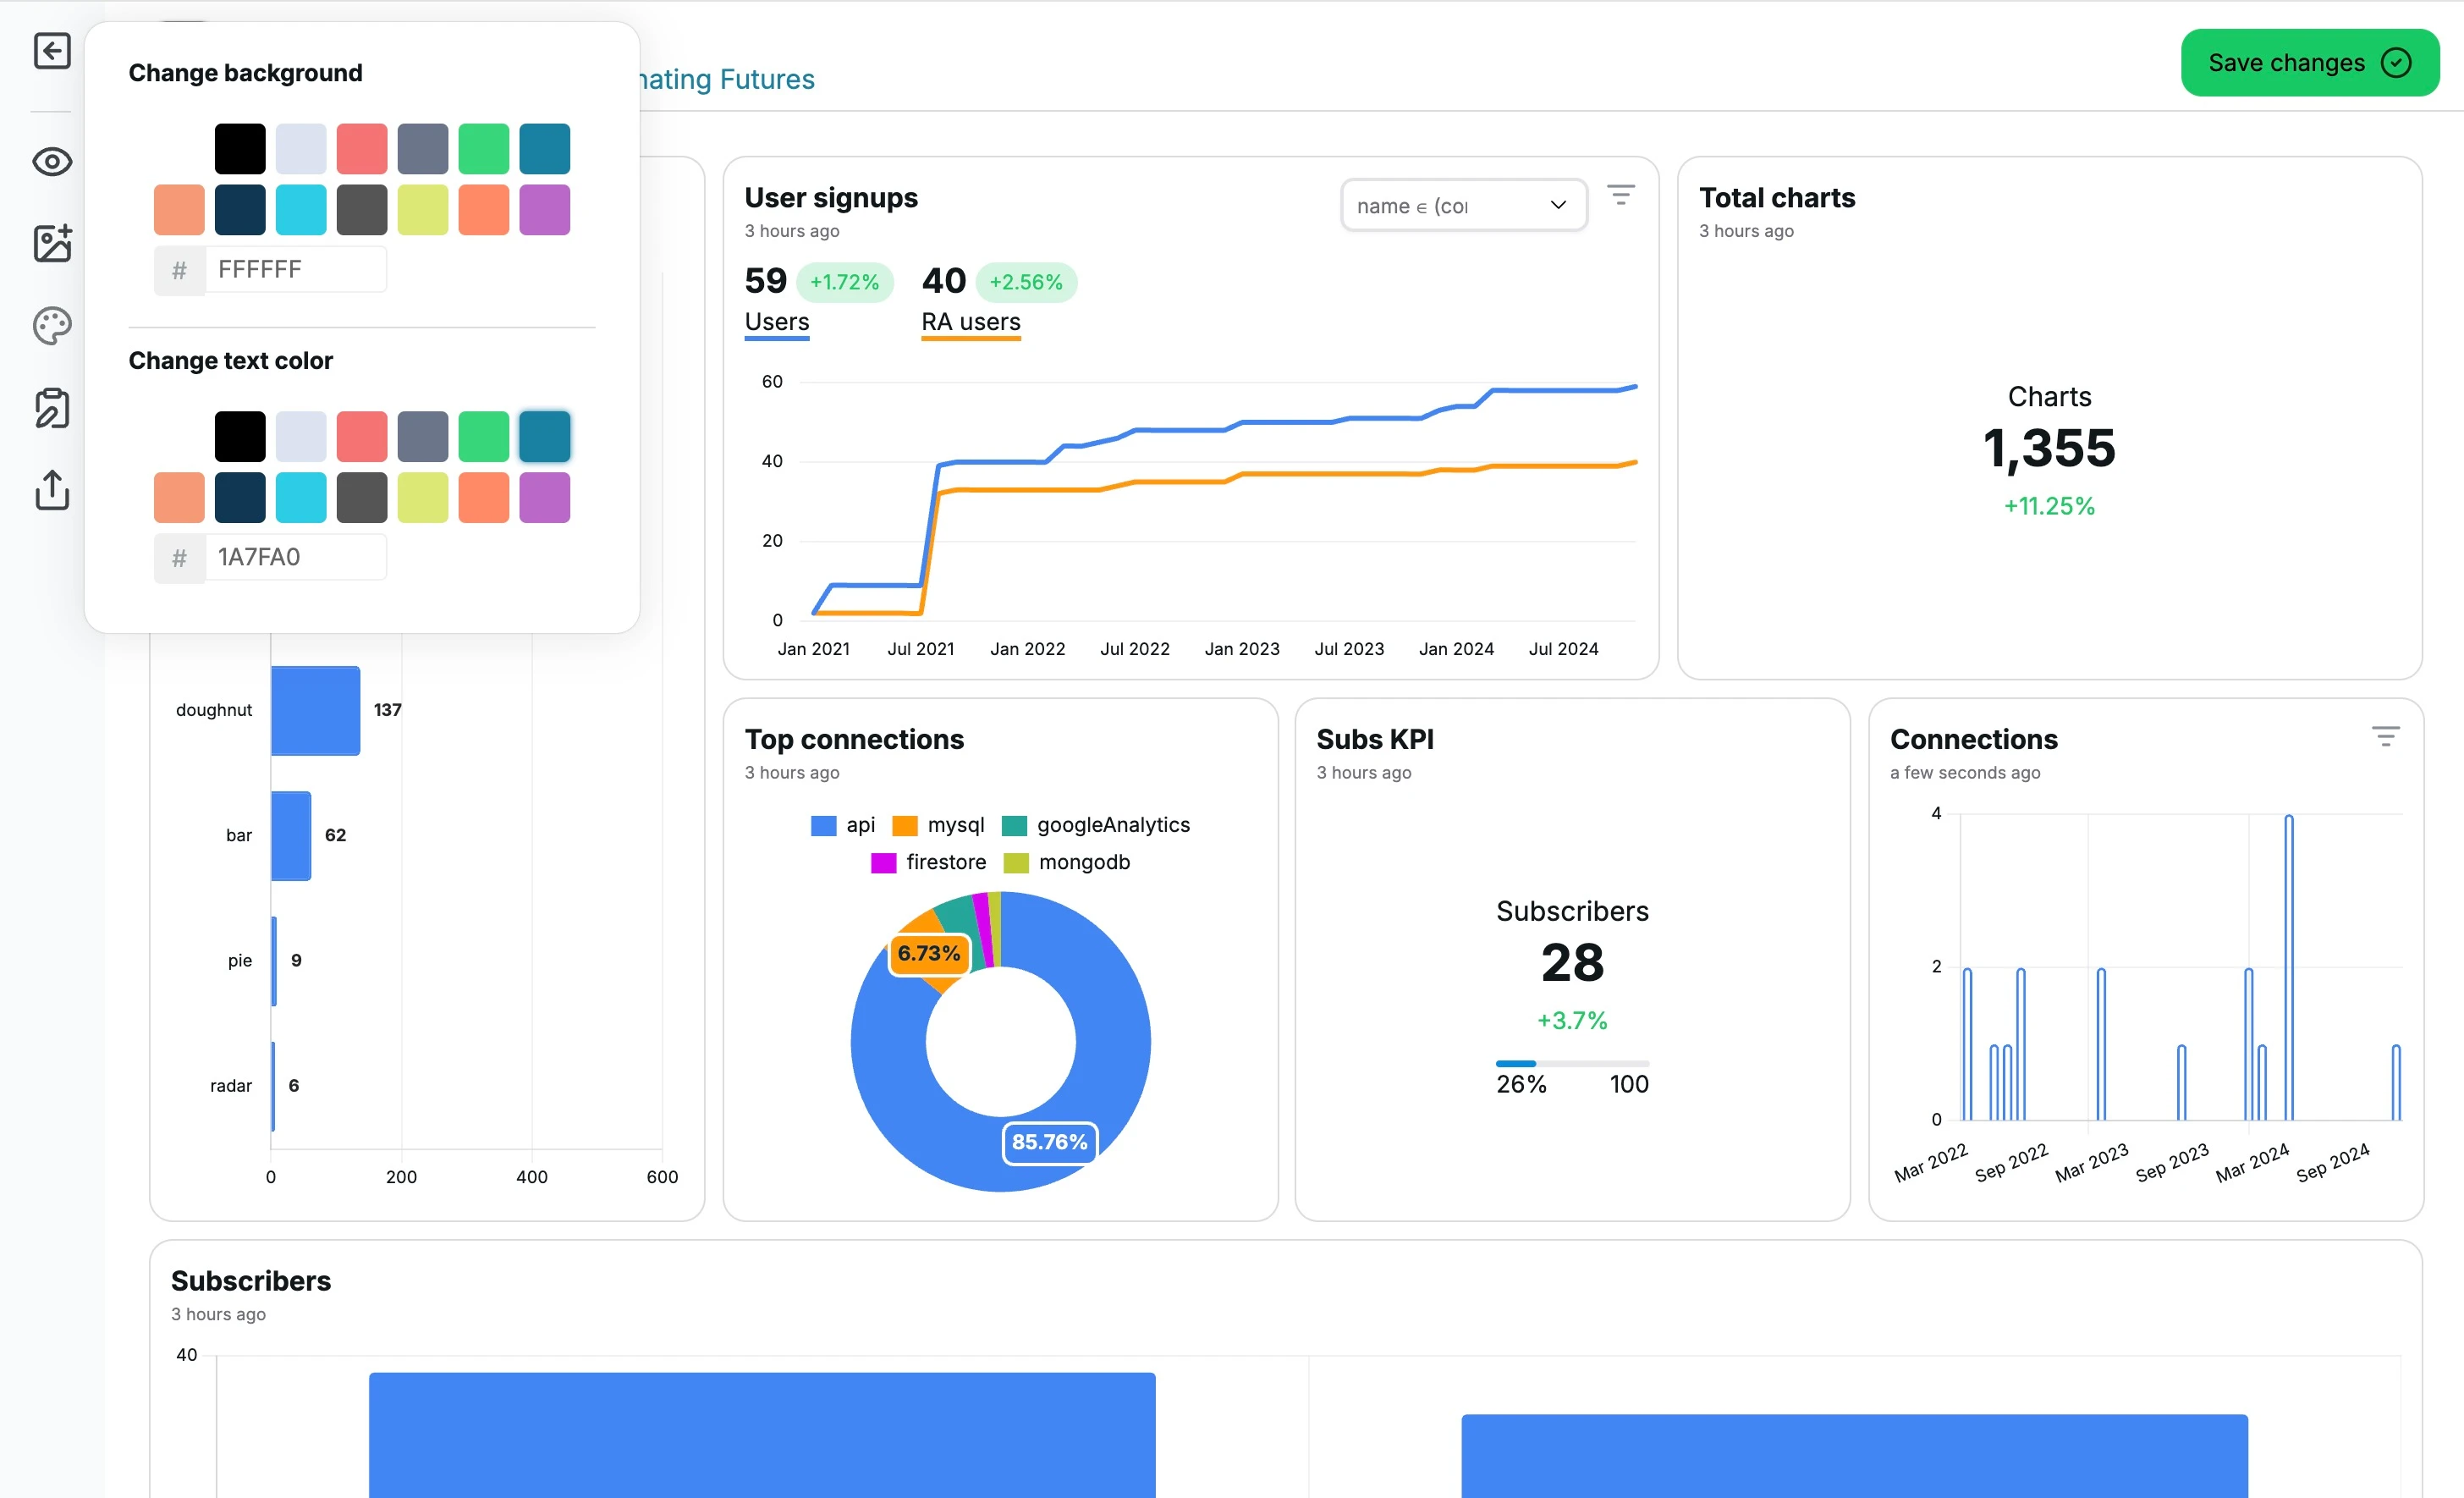
Chartbrew's report builder software lets you create stunning, data-driven reports without breaking a sweat. Whether you're a data analyst, team manager, or small business owner, our report designer simplifies the process of turning raw data into actionable insights.
Connect directly to your databases and take advantage of our powerful SQL report generator to build custom queries or let our intuitive database report generator guide you step by step. Create reports that are tailored to your audience, showcasing the metrics that matter most.
Made for your workflow
What you can do.
Drag-and-Drop Interface
Create professional reports without coding. Our intuitive drag-and-drop interface makes report building accessible to everyone on your team.
Custom Visualizations
Choose from a wide range of charts, graphs, and visualization options to present your data in the most impactful way.
Real-Time Updates
Keep your reports current with automatic data refreshes and real-time updates from your connected data sources.
Interactive Elements
Add filters to let your audience explore the data on their own terms.
White Labeling
Customize the look and feel of your reports with your brand colors, logos, and styling to maintain brand consistency.
Data alerts
Set up data alerts to get notified when charts reach a certain threshold or encounter anomalies.
