March 6, 20254 min read
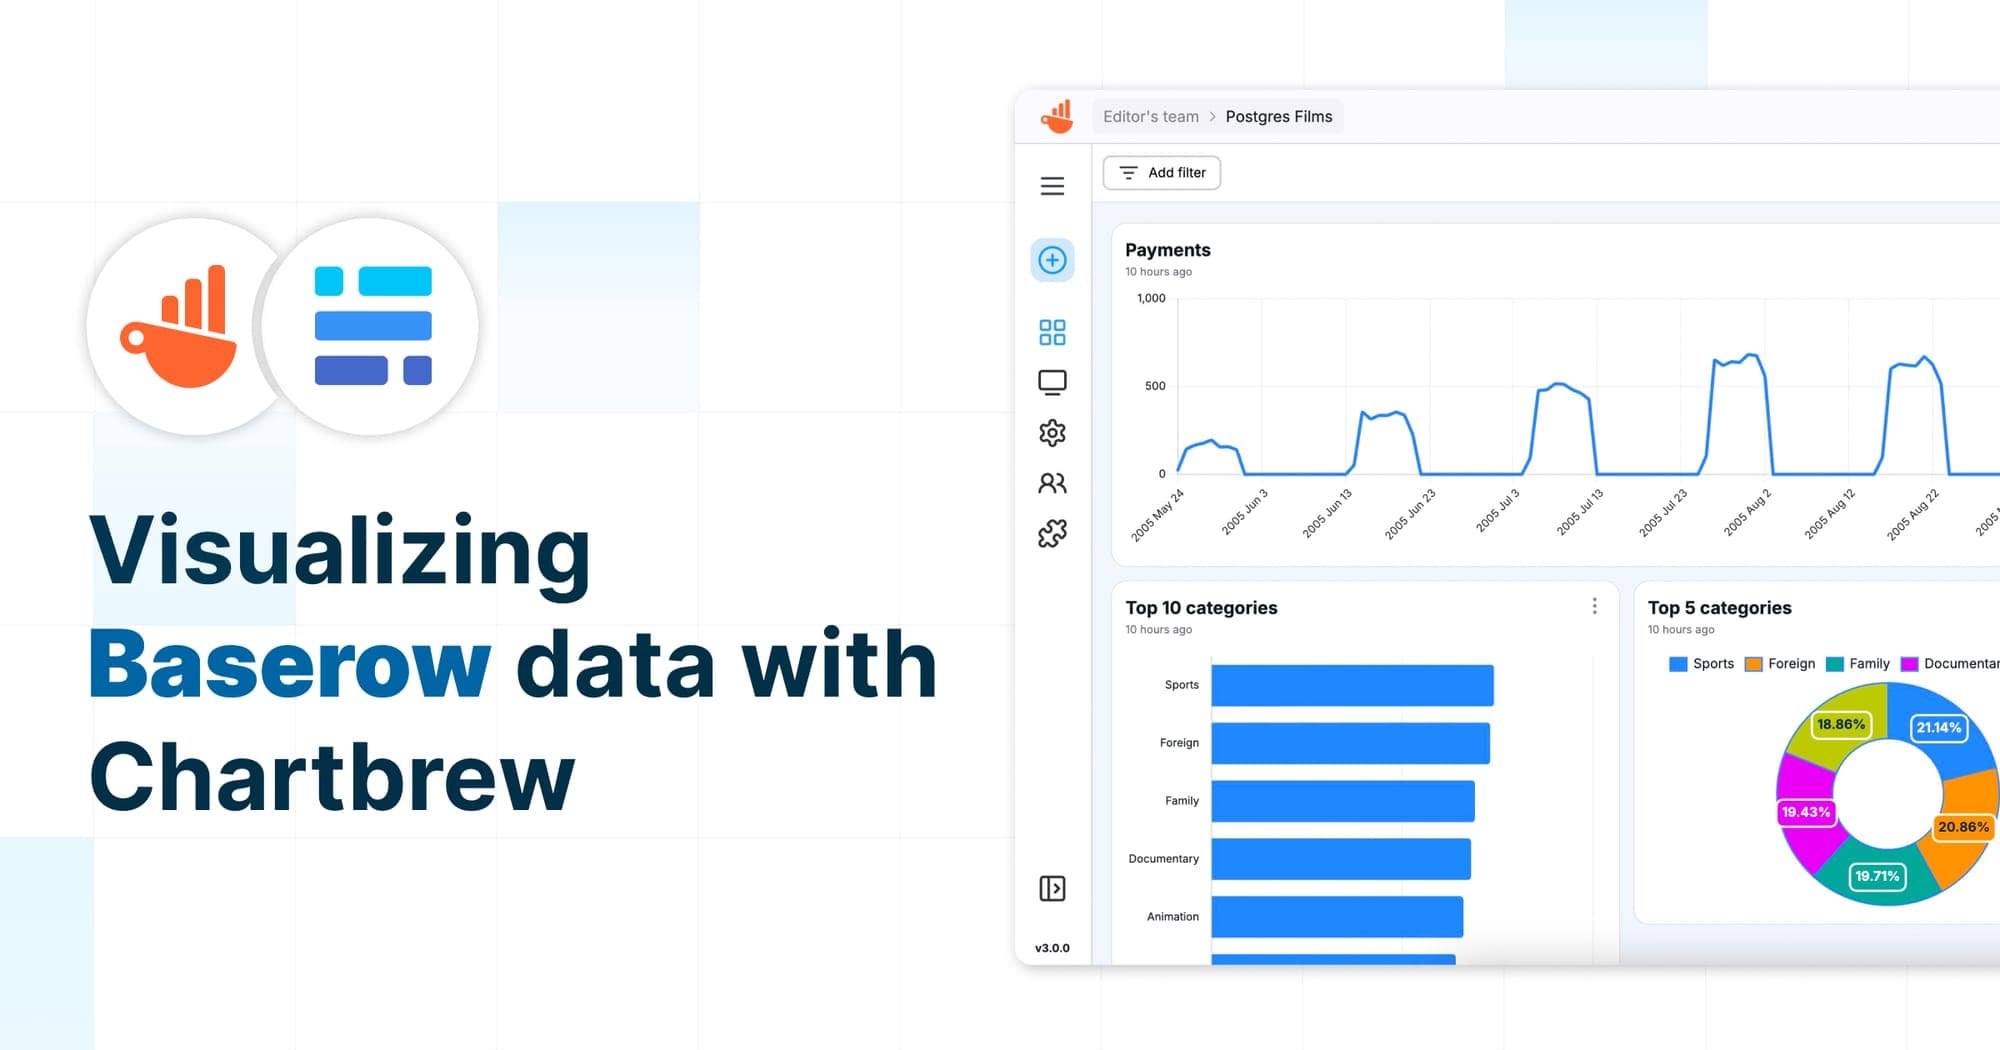
Visualizing ClickHouse Data with Chartbrew: A Step-by-Step Guide
Learn how to connect ClickHouse to Chartbrew, write SQL queries, and build dynamic charts. This guide walks you through setting up a data source, creating datasets, and automating updates for real-time insights.
integrationtutorial